Free & open source for macOS & Raycast
Never hit a |
by surprise again
Claude Code Usage Monitor for macOS & Raycast
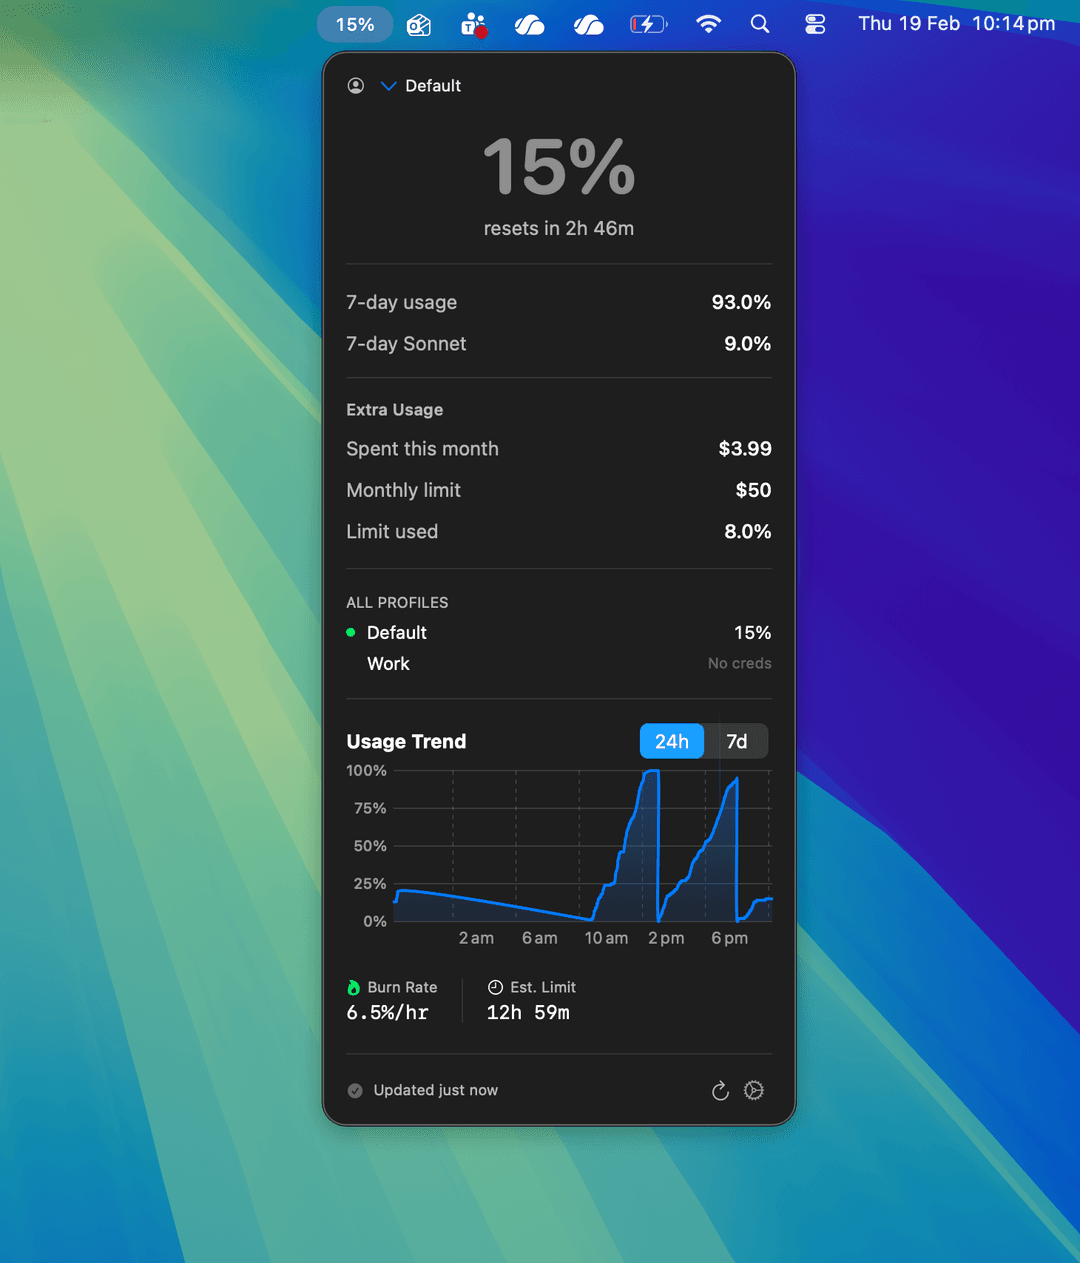
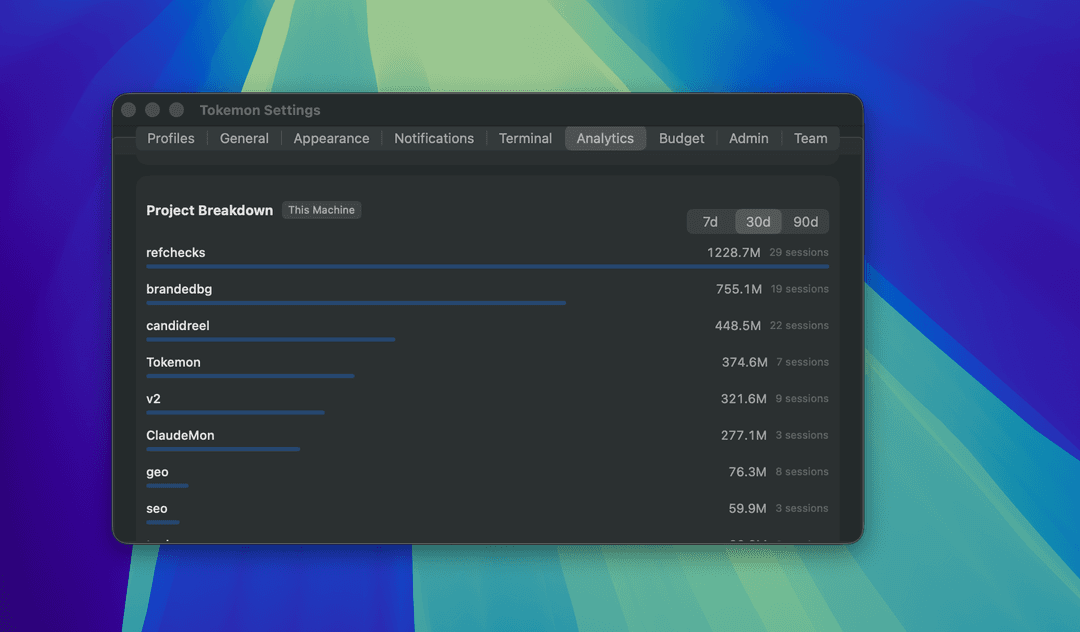
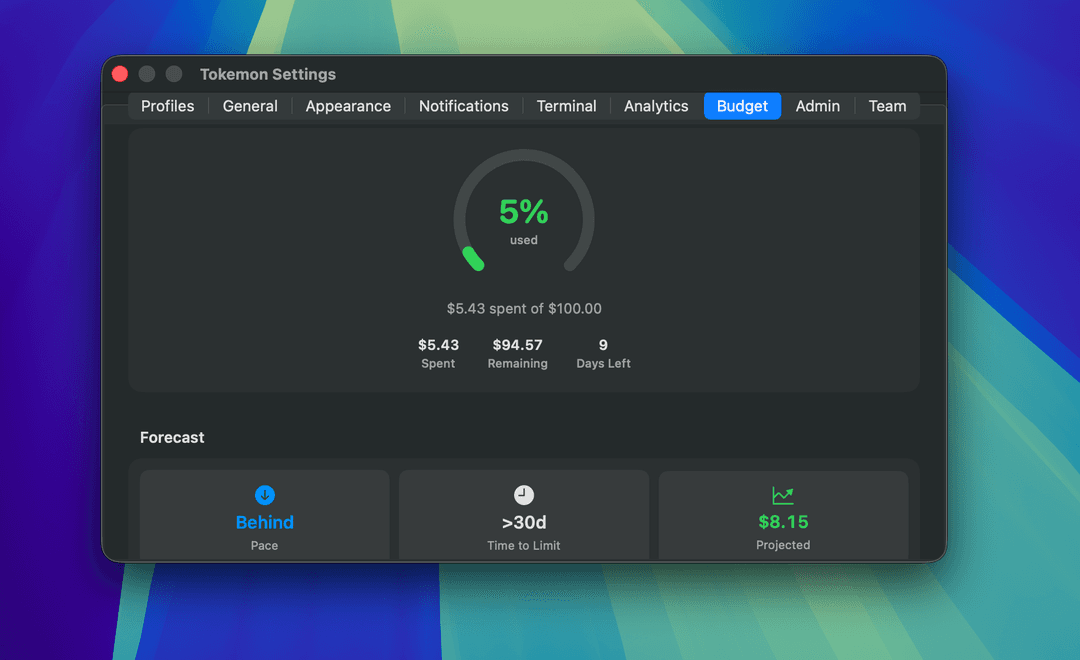
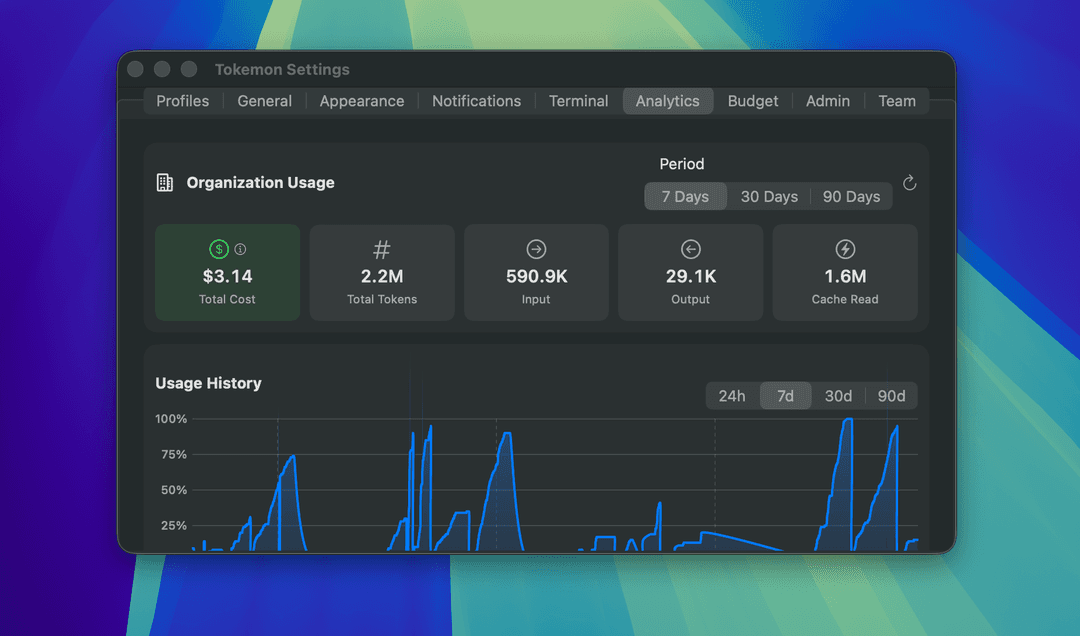
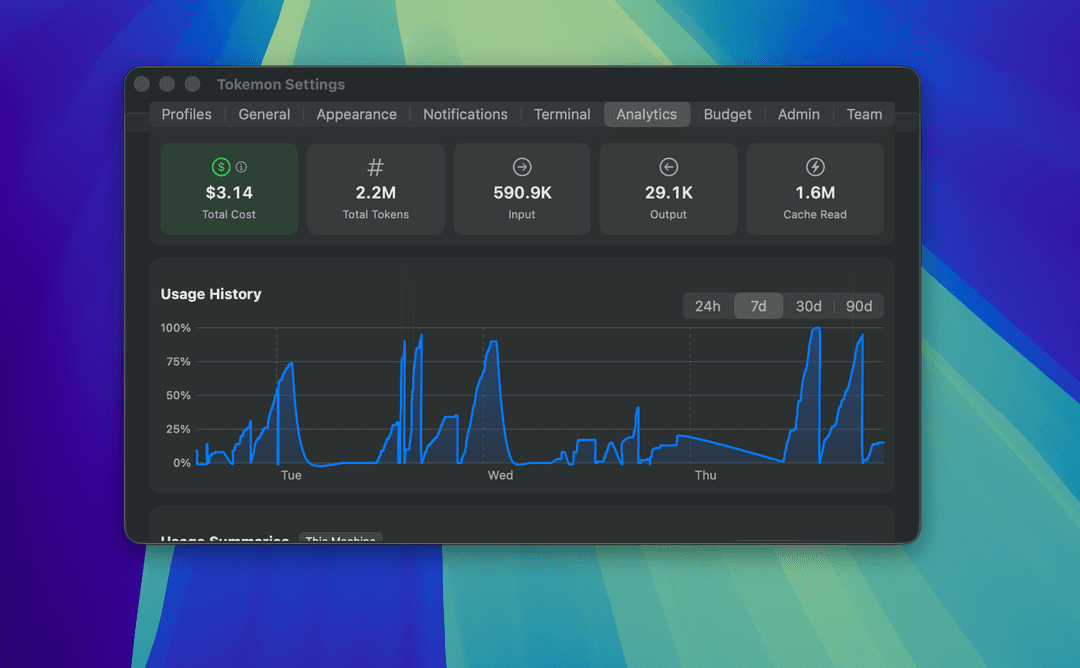
Tokemon shows your Claude usage in real-time — from your menu bar, a floating window, or Raycast. Track session limits, burn rate, project costs, and team budgets.
Free & open source under the MIT license
Terminal
Tue 10:13 PM
claude — ~/refchecks
37%
5-hour usage
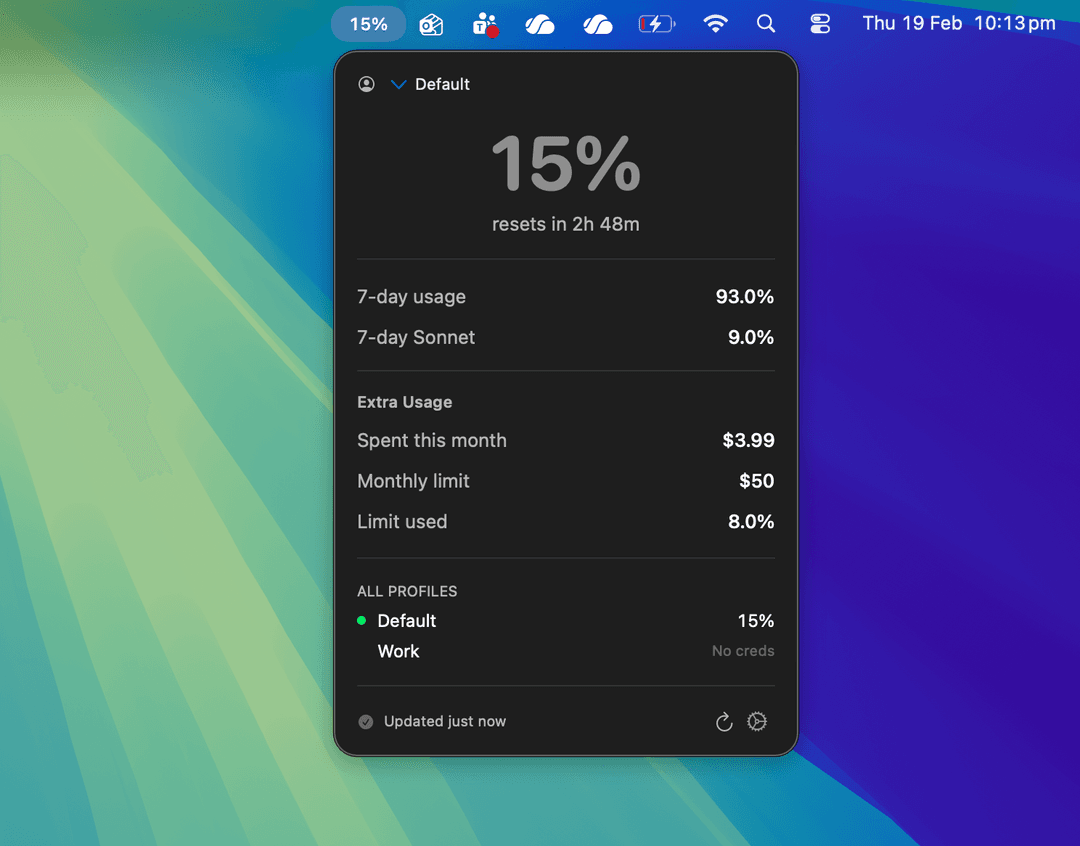
Click the menu bar icon to see the popover
Terminal
█